PHARMA DIVISION /
 Analytics
Analytics
The first integrated system
for data analysis in pharmacies.

From VIOLA Innovation Lab, in collaboration with the most important
European groups in data analysis, Iride Analytics is born.
The first system that analyzes the complete customer experience
within the point of sale.
What does Iride Analytics do?
Optimizes sales performance
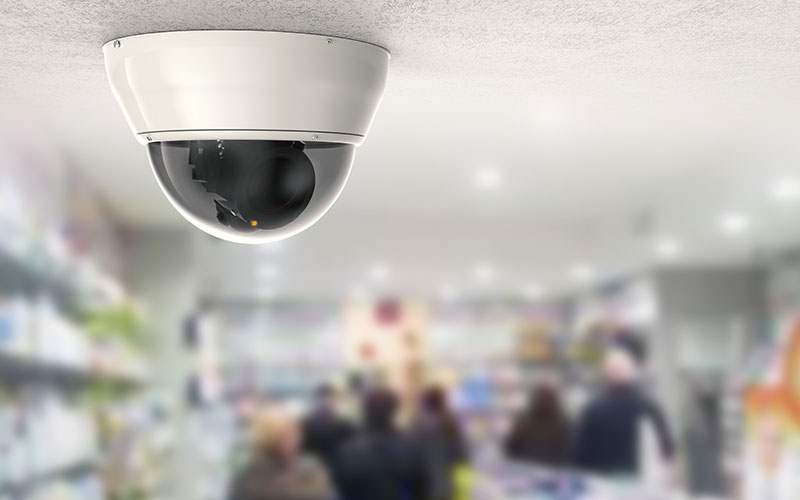
Iride Analytics, through the use of cameras inside the point
sales and analysis system that collects and interprets anonymous metadata,
is able to process in real time:
1. Number of entries to the point of sale.
2. Heatmap that detects the most or less frequented areas.
3. Customer journey during their shopping experience.
4. Monitor queues and help manage staff even during peak hours.
5. Time spent in a defined space.
6. The profitability of each m² of the store.
7. Customer profiling by gender and age group.
Communicates with ISYTech
Iride Analytics
is able to exploit ISYTech data,
our automated and intelligent drawer unit,
returning a precise analysis of the customer experience
and providing timely data on the sales
based on customer characteristics.
In fact, by combining sales data with customer flow data,
you get the full vision for the first time
of the pharmacy trend.
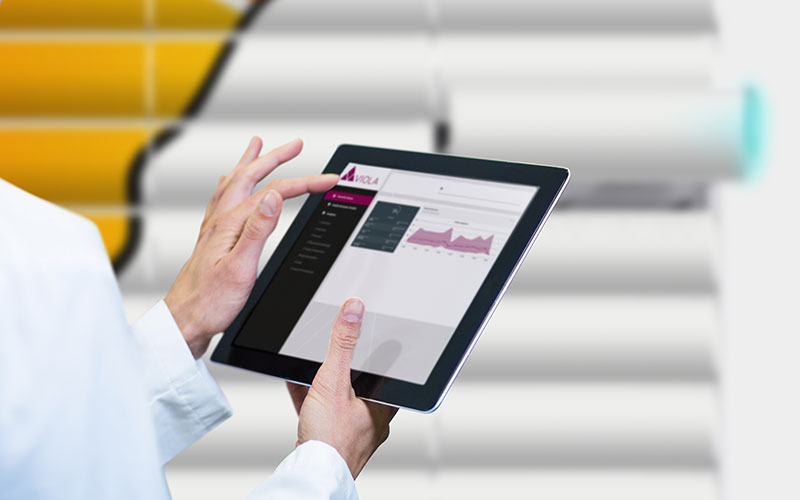
With Iride Analytics the pharmacist manages to exploit
to the full potential of the Internet-of-Things and Big Data,
all through a simple platform that offers data analysis
made easily understandable.
Which data does it provide?
1. The customers
- Number of entries: counts how many people enter the point of sale.
- Profiling: identifies the gender and age group of customers.
- Customer flow: analyzes behavior within the sale point (areas visited, stop times, etc.).
2. Staff and queue
- Real time monitoring: indicates the number of people in the queue in real time or in a selected period.
- Queue management: send pre-training queue notices to provide the pharmacist the best way to prepare his staff during peak hours.
- Service level: calculates and indicates the average time required to serve the cash customer.
- Abandonment rate: the percentage of people leaving the queue.
3. The sales area
- Heatmap: is the representation of customer paths in the various areas of the store, from areas with little traffic (cold colors) to areas with the greatest permanence and passages (warm colors).
- Customer paths: indicates customer behavior in the form of flows and directions
- Attention rate: measures the dwell time in one or more specifically defined analysis areas within the sales point.
- Division of areas: it is possible to divide the total area into different areas to obtain further analyzes on the performance of individual departments and areas of interest.
4. Performance
- Conversional rate: the number of sales divided by the number of entries, that is the percentage of people who bought in relation to the total number of people who entered the store.
- Profitability of the different areas: through the analysis of the flow of customers, the time spent and the products sold in a specific area, it is possible to understand the profitability of each m² of the store.
- Buying behavior: it is possible to have an in-depth view of the purchasing experience depending on the gender and age group of the customers.
Iride Analytics is the perfect system to optimize
sales performance in any retail environment,
anticipating the needs of customers and therefore
improving the customer experience.
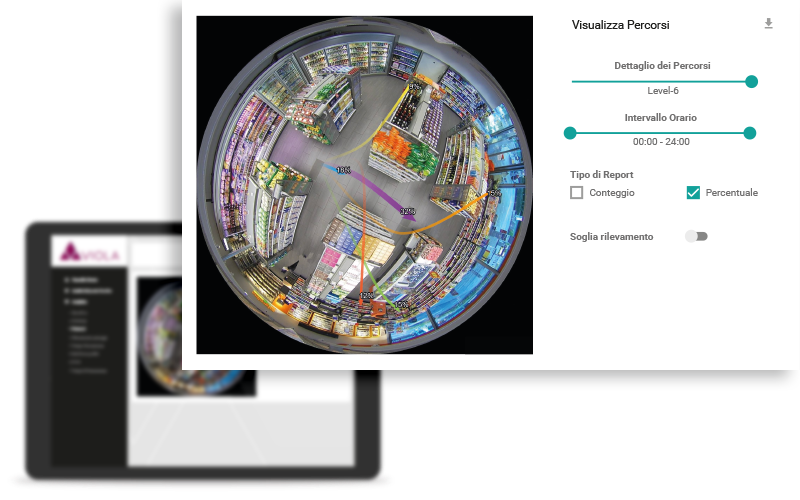
Spaces designed and optimized
The heatmap allows you tounderstand the shopping experience better
thanks to the display of customer paths and permanence times
in each area of the store at different times.
This information allows optimization of space and
the positioning of the products in promotion
as well as better staff management.
Why Iride Analytics?
VIOLA is the first company to implement large tools at 360 °
innovative for companies 4.0, offering all operators
of the retail environment makes a channel of advantages.
1.
PHARMACEUTICAL COMPANIES
They can adapt policies
and commercial activities at
needs and characteristics
of individual pharmacies.
2.
MARKETING COMPANIES
They can carry out in depth
analyzes of the
customer experience.
3.
ARCHITECTS AND SUPPLIERS
They can design sales points
more effectively and thus
enhance their design.
Need further information?
Register to download the full catalog, technical files andmuch more!

Back To Top